Observability Dashboard
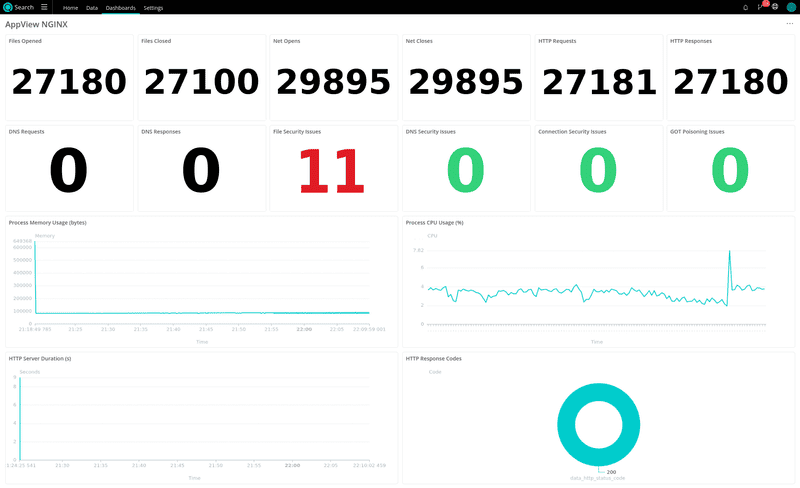
Today we will be building an observability dashboard to allow you to remotely monitor the behavior of an NGINX web server. The resulting dashboard will look something like this:
In order to achieve this result we will use:
- AppView
- Cribl Edge
- Cribl Search
...all of which do not require a paid license.
Overview
In this example we will monitor a node that runs the popular NGINX web server, by loading AppView into the NGINX application. AppView will send metrics and events to a local instance of Cribl Edge. That Edge node will connect to a fleet in the Cloud, allowing us to use Cribl Search to display a dashboard and perform queries on the data.
Why AppView?
AppView is the only application that can instrument applications without any code modification, and the only application that will automatically decrypt data to get info like HTTP headers. It is also uniquely detecting Security Issues like those defined by Mitre, in real-time.
Why Cribl?
Cribl Edge is a lightweight agent that can be centrally managed by a leader in groups of thousands of nodes. Using Edge allows us to remotely configure the connection to AppView and make the data available in Cribl Search. Note, that we are not sending the data to any destination, instead it is spooled to disk on the node and the amazing Cribl Search is able to pull in the data to resolve queries and light up a dashboard.
Deployment
AppView
Download AppView from the GitHub Releases page and make it executable with:
curl -Lo appview https://github.com/appview-team/appview/releases/download/v1.0.0/appview-x86_64
curl -Ls https://github.com/appview-team/appview/releases/download/v1.0.0/appview-x86_64.md5 | md5sum -c
chmod +x appview
Cribl Edge
- Make a free account on cribl.cloud and sign in.
- Click
Manage Edge, clickdefault_fleet, clickAdd Edge Node -> Linuxand note the authtoken and leader hostname in the command. Close the dialogue box but keep the page open. - Download and run Cribl Edge:
curl -Lso - $(curl https://cdn.cribl.io/dl/latest-x64) | tar zxv
sudo mv cribl /opt/cribl-edge
cd /opt/cribl-edge/bin/
./cribl mode-managed-edge -H <your-leader-hostname> -p 4200 -u <your-authtoken-here> -S true
# Replace the params between <> above using your cloud account info.
./cribl start
- Go back to the cribl.cloud webpage and after a minute or so you should see 1 Edge Node.
- We can now remotely configure that node. Click
More -> Sources, clickAppScope. (AppScope and AppView are compatible at this point). - Click
in_appscopeand set the following:
-
General Settings
- Unix domain socket: Yes
- Unix socket path: /opt/cribl-edge/state/appscope.sock
- Authentication method: manual
- Auth token: <leave empty>
- Unix socket permissions: 777
-
Processing Settings -> Disk Spooling
- Enable disk spooling: Yes
- Bucket time span: 1h
- Click
Saveto close the modal then clickEnabled -> yes. - Click
Commit and Deploy, enter an arbitrary commit message and hitCommit and Deploy. - After a minute, the remote Edge node will receive and implement the new configuration and start listening to AppView on the Unix Socket.
NGINX
Restart NGINX with AppView loaded: (Another method would be to attach AppView to an already-running NGINX)
sudo nginx -s stop
sudo ./appview run -c unix:///opt/cribl-edge/state/appscope.sock -- nginx # Starting nginx requires root privileges
At this point we should verify a couple of things:
sudo ./appview ps # Confirm that nginx is started and AppView is loaded
sudo ./appview inspect # Should show interfaces: cribl: connected: true
At this point, you might want to start making some requests to the NGINX server. We can use Apache's AB utility to simulate activity by installing it and running a script, like:
sudo apt install apache2-utils
vi abclient.sh
#!/bin/bash

while true; do
  # Run Apache Benchmark with 100 requests (-n) and 10 concurrent requests (-c)
  ab -n 10 -c 10 http://127.0.0.1:80/
  sleep 1
done
chmod +x abclient.sh
./abclient.sh
Cribl Search
The benefit of using Edge and Search together is that the Datasets and Dataset providers for AppView and Edge are already present in Search, so we don't need to do any additional configuration to locate that data.
- Back in cribl.cloud, transition to Search by clicking the Edge logo and clicking
Search. - Download the JSON for the dashboard
- Click
Dashboards, clickAdd Dashboard, give it a name and clickSave. Click... -> Edit as JSONthen import the dashboard.
At this point, your dashboard in Cribl Search should start lighting up (you might have to manually refresh the page) and you can start feeling the power of deep IT and Security observability.
Where to go from here
- Drill into the search panels to see the data behind the numbers by clicking Search on each panel.
- Modify the dashboard and the panel queries to suit your needs.
- Run AppView in multiple applications, either manually or with a set of application rules.
- Deploy Edge to multiple nodes.


