Analyzing Application Crashes
When an application crashes, you can use AppView together with eBPF to generate useful files and send those files to a network destination, before the environment is torn down.
In the walkthrough that follows, we'll run Nginx in a Docker container, force Nginx to crash, and send crash data – backtrace, core dump, and snapshot files – through Cribl.Cloud to Amazon S3.
If you prefer, you can easily adapt the procedure to analyze a crash of any process (not just Nginx); run on the host rather than a container; or, route the crash data to any network destination (not just Cribl.Cloud). You can even skip the network destination entirely and just view the crash files on disk.
Prerequisites
You will need:
- An Amazon S3 account.
- A Linux host with Docker installed.
- A Cribl.Cloud instance – you can sign up for a free account at https://cribl.cloud.
Setting Up Your Cribl.Cloud Instance
In Cribl.Cloud, start by creating an Amazon S3 Destination:
- Click Manage Stream.
- Under Worker Groups, click
default. - Click Data > Destinations and choose the Amazon S3 Destination.
- Click Add Destination and configure the Destination with your S3 credentials and preferences.
- Click Save.
Next, configure the built-in TCP Source:
- Click Data > Sources and choose the TCP Source.
- Click the built-in
in_tcpSource, enable it, and configure it with address0.0.0.0and port10060. - Click Connected Destinations and choose QuickConnect. Select your S3 Destination.
- Click Save.
- Click Commit and Deploy.
You now have a Cribl.Cloud Worker listening for TCP data, and configured to send it on to S3.
Setting Up AppView and eBPF
The appview-ebpf and AppView projects are separate and independent, and they operate under different licenses – for that reason, each has its own repo.
Download the AppView binary:
cd ~/Downloads
curl -Lo appview https://github.com/appview-team/appview/releases/download/v1.0.0/appview-x86_64
curl -Ls https://github.com/appview-team/appview/releases/download/v1.0.0/appview-x86_64.md5 | md5sum -c
chmod +x appview
Download and build the appview-ebpf binary:
git clone git@github.com:appview-team/appview-ebpf.git
cd appview-ebpf
make all
Deploy the eBPF module to listen for crashing applications:
sudo ~/Downloads/appview-ebpf/bin/appview-ebpf
Leave this shell running and open another terminal or tab.
Deploy the AppView daemon, to receive messages from eBPF and send crash files to a network destination:
sudo ~/Downloads/appview daemon --filedest tcp://<path-to-cribl-cloud-tcp>:10060
Once you start the daemon, the appview-ebpf binary will exit in the other terminal. That's normal.
At this point, preparation is complete:
- The eBPF kernel module should be loaded, listening for application crash signals.
- The AppView Daemon should be running, waiting for the eBPF module to tell it that an application has crashed.
- Once eBPF notifies AppView of a crash, AppView will look for crash files and send them on to the configured network destination.
Making an Application Crash
Start a daemonized Nginx container:
docker run --rm -d nginx
Attach AppView to the containerized Nginx process, and enable backtrace and core dump on crash:
sudo ~/Downloads/appview attach --backtrace --coredump nginx
This command shows the Nginx process with its child processes, in a list. Note the PID of the parent Nginx process.
(Alternatively, you could have used the appview run command or the appview rules command to tell AppView to load itself into an application when it starts.)
Force a crash of Nginx by sending the process a BUS error signal:
sudo kill -s SIGBUS <PID_of_nginx>
AppView will respond to any of the usual signals of a crashing process: SIGBUS, SIGINT, SIGSEGV, or SIGFPE.
Now look in your S3 bucket – you should see four files: info, backtrace, snapshot, and cfg. The same files, plus the core dump, should also be in /tmp/appview/<PID_of_nginx>/.
Investigating the Crash
Here are a few hints about the meaningful insights that the crash files provide.
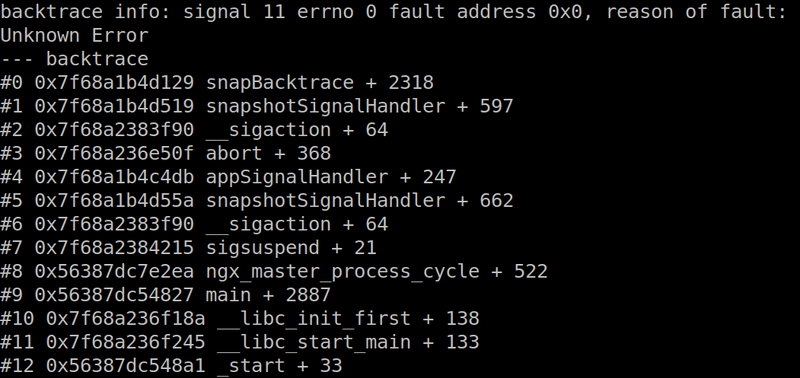
The backtrace file contains the application stack trace at the time of the crash:
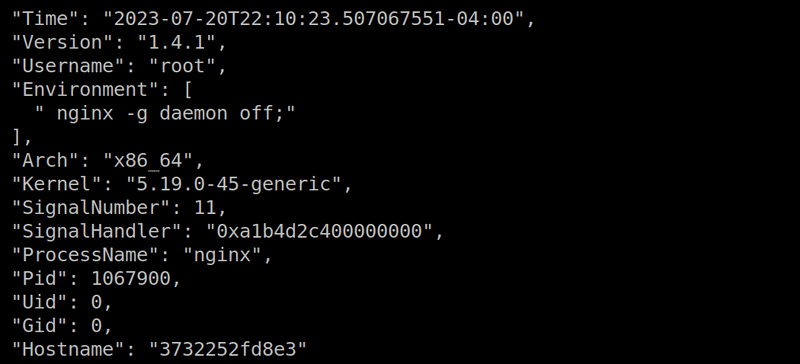
The snapshot file contains properties of the process:
The core dump (not shown here) contains a binary snapshot of the application at the time of the crash, for inspection with a debugger like gdb. By default, the daemon does not send this over the network since it's not usually useful outside of its origin environment. The man page on core dumps can help you explore this data.
If this topic is of interest to you, and/or if you'd like some help getting the procedure to work, please get in touch – there are a variety of ways to do that.


